
QtWebKit Guide - Canvas Graphics
Canvas Graphics
This section of the QtWebKit Guide serves as an introduction to the HTML5 Canvas API features of QtWebKit.
The HTML5 Canvas API enables you to draw within a Web page or Web App using JavaScript. After you define a rectangle that serves as your drawing canvas, you can draw straight and curved lines, simple and complex shapes, graphs, and referenced graphic images. You can add text, color, shadows, gradients, and patterns. The canvas API also enables you to save or export the canvas as a .png or .jpeg image file.
To define the drawing area, set the width and height of a <canvas> element. For example, the following sets a drawing area with a height of 100 pixels and width of 200 pixels:
<canvas id="mycanvas" width="100" height="200"></canvas>
By default, canvas elements are sized 150 pixels high and 300 pixels wide. You can also set the size of the canvas using CSS:
canvas { height : 200px; width : 100px; }The canvas element is transparent and has no visible borders until you access the 2D rendering context.
Resetting the width or height of an existing canvas erases its contents and resets all the context properties of the canvas to their default values.
Accessing the Rendering Context
The rendering context defines the methods and attributes needed to draw on the canvas. QtWebKit currently supports the two-dimensional rendering context. The following assigns the canvas rendering context to a context variable:
var context = canvas.getContext("2d")
The 2d context renders the canvas as a coordinate system whose origin (0,0) is at the top left corner, as shown in the figure below. Coordinates increase along the x axis from left to right and along the y axis from top to bottom of the canvas.
Drawing Shapes
The 2D rendering context supports rectangles, lines, and arcs, which you can combine to build complex shapes and graphic images.
Drawing Rectangles
The rectangle is the only geometric shape that is built in to the canvas API. You can draw an outline of a rectangle, a filled rectangle, and a filled rectangle with clear parts. You do not have to create a path to draw a rectangle.
To draw an outline of a rectangle, use the strokeRect() method.
To draw a filled rectangle, use the fillRect() method. The default fill color is black.
To clear part of a filled rectangle, use the clearRect() method.
Each method accepts the following series of arguments:
xis the position on the canvas to the right of the origin (0,0) of the top left corner of the rectangleyis the position on the canvas below the origin of the top left corner of the rectanglewidthis the width of the rectangle to be drawnheightis the height of the rectangle to be drawn
For example, the following code draws concentric rectangles:
    var context = canvas.getContext("2d");
    canvas.strokeRect(50,50,50,50);
    canvas.fillRect(60,60,30,30);
    canvas.clearRect(70,70,10,10);
Drawing Lines
To draw a line, you first have to "put your pencil down" on the canvas by creating a path. The context.beginPath() method sets a new path in the canvas. Each line that you draw is stored as a sub-path. Sub-paths can be closed to form a shape, or they can be left open. Each time you want to draw a new shape, you have to call the beginPath() method to reset the current path.
After calling beginPath(), you set your starting position on the canvas by calling the context.moveTo(x,y) method. The moveTo(x,y) method creates a new subpath on the canvas that begins at the Cartesian point (x,y).
To draw a straight line, call the context.lineTo(x,y) method. This adds the point (x,y) to the current subpath and connects it to the previous subpath by a straight line. In other words, (x,y) are the coordinates of the line's endpoint. For example:
    context.beginPath();
    context.moveTo(10,10);
    context.lineTo(30,30);
To get the pencil to actually draw on the canvas, first use the strokeStyle property to set the color to a value such as black (#000):
context.strokeStyle(#000);
(The strokeStyle property can be a CSS color, a pattern, or a gradient.) Then use the context.stroke() method to actually draw the line on the canvas:
context.stroke();This produces the image below. The numeric coordinates are added for clarity but are not part of the image drawn by the code:
To create a shape, call the context.closePath() method:
    context.closePath();
    context.moveTo(10,10);        // starting point
    context.lineTo(30,30);        // specify first line
    context.moveTo(30,30);        // move to end of first line
    context.lineTo(60,10);        // specify second line
    context.moveTo(60,10);        // move to end of second line
    context.lineTo(10,10);        // specify third line to close triangle
    context.strokeStyle("#000");    // use black color for lines
    context.stroke();        // draws the triangle lines on the canvas
To fill the shape, use the fillstyle property and the fill() method:
    context.fillStyle("#FF0000"); // use red color for fill
    context.fill(); // fill the triangle
The commands, if coded fully, would create the shape below:
Note: It is not necessary to close the path when calling the fill() method. Calling fill() closes the path and creates the completed shape.
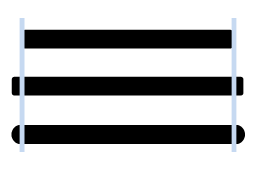
You can draw lines of various widths, endcap types, and joining options by configuring the following attributes:
lineWidthsets the thickness of the current line. The value can be any number greater than0. For example,context.lineWidth = 10sets the line thickness to10units. The default value is1unit, which is not the same as1pixel. Instead, the line is centered on the current path, with half its thickness on each side of the path.lineCapsets the type of endpoint of the current line. The value can be eitherbutt,square, orround. (The default value isbutt.)butt- the ends of the line abutt the line guide.squareadds a box at both ends of the line.roundadds a semicircle at both ends of the line.
lineJoinsets the style with which lines are joined. The value can be eitherbevel,round, ormiter. (The default value ismiter.)bevelflattens the corners at which the lines joinroundrounds the corners at which the lines joinmiterjoins the lines at a single point
miterLimitsets the miter limit ratio. The value can be any number greater than0. The miter limit ratio determines how far the connection point of the outside of the lines can be from the connection point of the inside of the lines. (The default value is10.)
Drawing Arcs
To draw an arc, you begin with the same steps your followed to create a line:
- Call the
context.beginPath()method to "put your pencil down" on the canvas and set a new path. - Call the
context.moveTo(x,y)method to set your starting position on the canvas at the point (x,y). - To draw an arc or circle, call the
context.arcTo(x1,y1,x2,y2,radius)method. This adds an arc with starting point(x1,y1), ending point(x2,y2), and radiusradiusto the current subpath and connects it to the previous subpath by a straight line.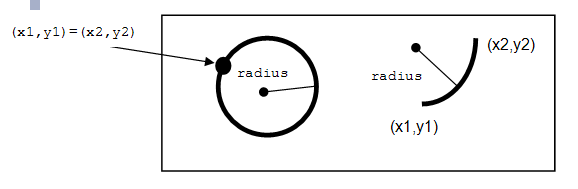
- An alternative way to draw an arc or circle is to call the
context.arc(x,y,radius,startAngle,endAngle,anticlockwise)method. This adds an arc to the current subpath that lies on the circumference of the circle whose center is at the point (x,y) and whose radius isradius.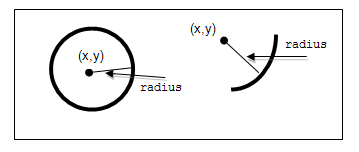
Both
startAngleandendAngleare measured from the x axis in units of radians.A complete circle is
360degrees, or 2Π radians. A semicircle is180degrees, or Π radians. The number of radians is the number of degrees multiplied by Π/180, expressed in JavaScript as:var radians = (Math.PI/180)*degrees;
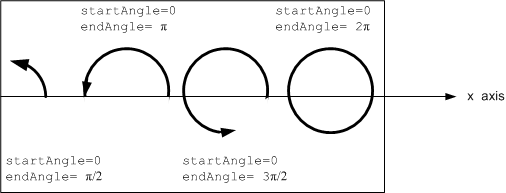
anticlockwisehas the valueTRUEfor each arc in the figure above because they are all drawn in the counterclockwise direction. - To create a shape, call the
context.closePath()method. This marks the current subpath as closed and draws a straight line from the current point to the first point in the path. - To draw only the outline of the shape, call the
context.stroke()method. - To fill in the shape, call the
context.fill()method. - To set the color of the fill, set the
strokeStyle. For example, the codecontext.strokeStyle = "#FF0000";
sets the fill color to red.
Note: It is not necessary to close the path if you are going to call the fill() method. The fill closes the path and creates the completed shape.
To create complex shapes, combine lines and arcs:
- Call the
context.beginPath()method to "put your pencil down" on the canvas and set a new path. - Call the
context.moveTo(x,y)method to set your starting position on the canvas at the point (x,y). - Draw any combination of lines and arcs by calling the
lineTo,arcTo,arc,moveTo,closePath,stroke, andfillmethods and setting the line attributes and fill colors as described above.
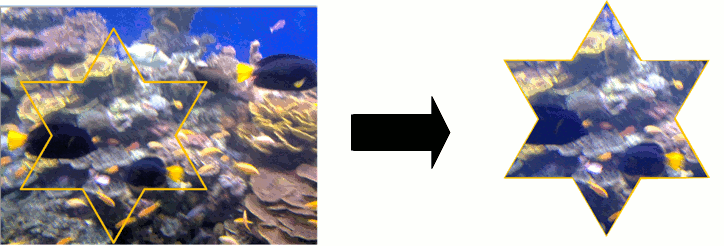
You can also create complex shapes by removing portions of the shapes you draw. The clip() method creates a clipping path that defines the area along which your "scissor" will cut. Any parts of the shape outside the clipping path are not displayed. To create a complex shape using the clip() method:
- Call the
context.beginPath()method to set the clipping path. - Define the clipping path by calling any combination of the
lineTo,arcTo,arc,moveTo, andclosePathmethods. - Call the
context.clip()method.
The new shape displays. The following shows how a clipping path can modify how an image displays:
Compositing
You can build complex shapes by drawing shapes on top of each other. It is also possible to draw shapes behind existing shapes and to mask parts of shapes by using compositing operations. The globalCompositeOperation attribute sets the way shapes can be combined.
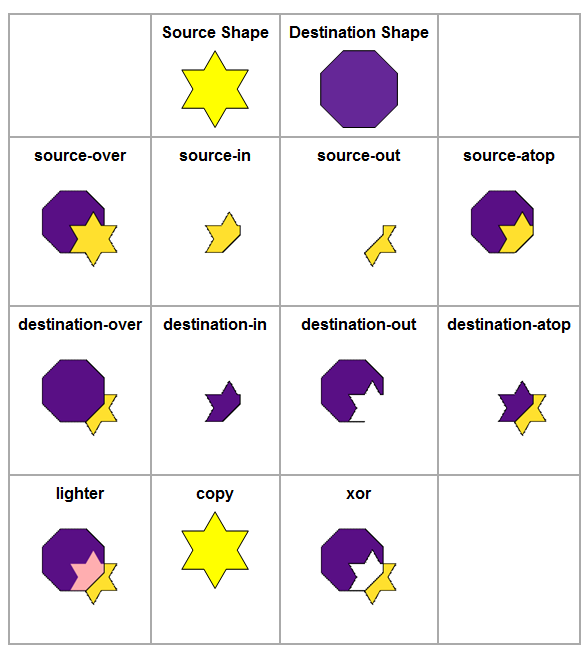
The first shape drawn on the canvas to which additional shapes are added is called the destination shape. The shape drawn on the canvas afterwards to create the composite image is called the source shape. The value of the globalCompositeOperation attribute must be set to one of the following:
source-overdisplays the source (newer) shape over the destination (older) shape unless the source shape is transparent. (This is the default value)source-indisplays only the portion of the source shape that is opaque and overlaps the destination shape. Everything else is transparent.source-outdisplays only the portion of the source shape that does not overlap the destination shape.source-atopdisplays only the portion of the opaque source shape that overlaps the destination shape and the portion of the destination shape that is not covered by the opaque source shape.destination-overdisplays the destination shape over the source shape. In areas where both shapes are opaque and overlap, the older shape displays.destination-indisplays only the portion of the destination shape that is opaque and overlaps the source shape. Everything else is transparent. The source (newer) shape is not visible.destination-outdisplays only the portion of the destination shape that does not overlap the source shape. The source shape is not visible.destination-atopdisplays only the portion of the opaque destination shape that overlaps the source shape and the portion of the source shape that is not covered by the opaque destination shape.lighterdisplays both the source and destination shapes. Where the shapes overlap, the their color values are added, producing a lighter color.copydisplays only the source shape. The destination shape is ignored.xordisplays both the source and the destination shapes except the areas of overlap, in which both shapes are completely transparent.
The following figure shows the various compositing effects:
Saving and Exporting Canvas Drawings as Image Files
You can save or export your canvas drawings as .png or .jpeg image files by calling the toDataURL() method:
canvas.toDataURL([type, ...])
where:
typeis the MIME type to which you want to save or export your canvas. Possible values are:"image\png"(Default value)"image\jpeg"
...represents additional arguments that depend on the MIME type.- If
typeispng, this argument is" " - If
typeisjpeg, this argument is the desired quality level of the image. The value is a number in the range 0.0 to 1.0, inclusive.
- If
Drawing Text
You can draw text on your canvas by setting the following font attributes on the 2d drawing context:
fontrefers to any font, expressed the same way as in CSS properties. This attribute's value can include any font style, variant, weight, size, height, and family. For example:context.font = "12pt Arial";
The default value is
10px sans-serif.If you set the
fontattribute to a relative font size, the browser multiplies it by the computed font size of the<canvas>element itself. For example:context.font = "200%";
textAlignspecifies the alignment of the text. The values can be one of the following:leftfor left-aligned textrightfor right-aligned textcenterfor text that is centered within each linestart(default) - the text is aligned at the beginning of the line. Text is left- or right-justified based on locale-specific writing method: left when text is left-to-right, right when text is right-to-left.end- the text is aligned at the end of the line, either left or right depending on locale-specific writing method.
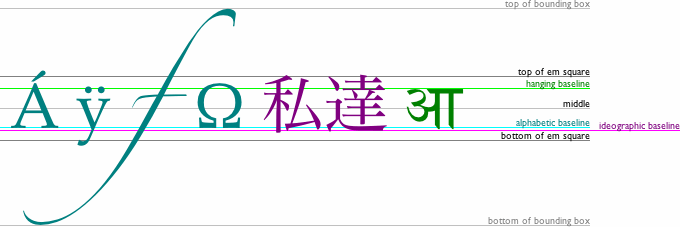
textBaselinespecifies the position at which text is drawn relative to a baseline. The figure below, from HTML5 Canvas API, illustrates the possible values for thetextBaselineattribute:topis the top of the em square, which approximates the top of the glyphs in a fonthangingspecifies a hanging baseline, where the tops of some glyphs are anchored.middleis the mid-point of the em squarealphabetic(default) is the anchor point of many alphabetic charactersideographicis the anchor point of many ideograms, such as the characters used in the writing systems of many Asian languagesbottomis the bottom of the em square
To draw text on a canvas:
- Set the
fontattribute on the drawing context. For example:context.font = "bold 11px arial"
- Measure the text that you want to draw by calling the
measureTextmethod:TextMetrics measureText("Text to draw");where
TextMetricsis the object returned. Itswidthattribute is the width, in pixels, that the"Text to draw"would be when drawn with the font specified by thefontattribute. - Call either of the following methods:
fillTextdraws the text with the font style specified by thefontattribute, the alignment specified by thetextAlignattribute, and the baseline specified by thetextBaselineattribute. For example:context.fillText("Text to draw",x,y,maximumWidth);
where
xandyare the coordinates at which the drawing begins (the anchor point), andmaximumWidthis the maximum width of the text string (optional). If thewidthreturned in step 2 is larger than themaximumWidth, the font is scaled down until the width of the text string is less than themaximumWidthspecified.If you don't specify the
fontattribute, the text inherits the font size and style of the<canvas>element itself.strokeTextis the same as thefillTextmethod, except that a stroke style is applied to the text instead of a fill style, creating outlines of glyphs. For example:context.fillText("Text to stroke",x,y,maximumWidth);
Working with Images
You can insert existing images onto your canvas, you can scale or crop them, and you can combine them to create composite images. You can also draw new images by creating an Image() object with JavaScript.
To insert an existing image onto a canvas, call the drawImage method:
context.drawImage(image, dx, dy, dw, dh)
where:
imageis a reference to an HTML<image>or<canvas>element. The image must be fully loaded before you can draw it on the canvas. The reference cannot be a URL. Instead, it should be referenced using standard DOM methods such asdocument.images()ordocument.getElementById(). For example:<canvas id="demo1" width="100" height="150"></canvas> var canvas = document.getElementById("demo1"); var context = canvas.getContext("2d");
dxis the x coordinate of the upper left corner of the image to be drawn on the canvas (the destination image)dyis the y coordinate of the upper left corner of the destination imagedwis the width of the destination image (optional)dhis the height of the destination image (optional)
If dw and dh are not specified, the image retains its source dimensions when drawn on the canvas. When dw and dh are specified, the image is scaled to width dw and height dh when drawn on the canvas.
If you want to crop the source image, the drawImage method can be overloaded with the following arguments:
context.drawImage(image, sx, sy, sw, sh, dx, dy, dw, dh)
where:
sxis the x coordinate of the upper left corner of the cropped source imagesyis the y coordinate of the upper left corner of the cropped source imageswis the width of the cropped source imageshis the height of the cropped source image
Use this method if you want to crop the source image to the rectangle (sx, sy, sw, sh) before drawing it on the canvas. The destination image will have width dw, height dh, and upper left corner at coordinates (dx,dy) on the canvas.
To create a new image using JavaScript, create an Image object and define its source. Use an onload event handler to ensure that the drawImage method is not called until the image has finished loading. For example:
var graphic = new Image();
graphic.src = "clipart/graphic.png";
The image begins to load.
graphic.onload = function(){
    context.drawImage(graphic,x,y);
};
Creating Patterns with Images
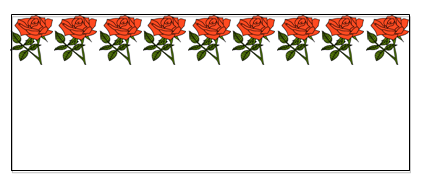
You can create patterns with an image by repeating it horizontally, vertically, or both. The top left corner of the first image must be anchored at the origin of the coordinate space. To repeat an image, call the createPattern method:
context.createPattern(image, repetition);
where:
imageis a reference to an HTML<image>or<canvas>element that is repeated to form a pattern. The image must be fully loaded before you can draw it on the canvas. The reference cannot be a URL. Instead, it should be referenced via standard DOM methods such asdocument.imagesanddocument.getElementById. For example:<canvas id="demo1" width="100" height="150"></canvas> var canvas = document.getElementById("demo1"); var context = canvas.getContext("2d");
repetitionis the direction in which the image repeats to form the pattern. Possible values are:repeat(default) the image repeats both horizontally and verticallyrepeat-xthe image repeats horizontallyrepeat-ythe image repeats vertically
The repeated images are the same size as the source image. The createPattern method does not scale the images.
For example, to create a horizontal pattern of roses, create an Image object to use as a pattern and define its source. Use an onload event handler to ensure that the createPattern method is not called until the image has finished loading. For example:
    var roses = new Image();
    roses.src = "clipart/roses.jpg";
The image begins to load.
    roses.onload = function(){
        var pattern = context.createPattern(roses,repeat-x);
    };
Applying Colors
To draw the outline of a shape in color, set the strokeStyle attribute to any valid CSS color value. The color value can be in hexadecimal notation or in RGB/HSL notation, as described in Specifying Color and Opacity. For example, either of the following sets a shape's outline to red:
context.strokeStyle = "#FF0000"
context.strokeStyle = "rgb(255,0,0)"
To fill a shape with color, set the fillStyle attribute to a l{CSS Color Value}{CSS color value}. The color value can be in hexadecimal notation or in RGB/HSL notation. For example, either of the following colors a shape's interior as blue:
context.fillStyle = "#0000FF"
context.fillStyle = "rgb(0,0,255)"
The CSS3 Color Module specification extends both RGB and HSL color models to include a color's opacity, referred to as its alpha. These extended models are known as RGBA and HSLA. There are no hexadecimal notations for RGBA and HSLA values. The following specifies varying levels of opacity for a blue shape:
context.fillStyle = rgba(0, 0, 255, 0)        // transparent
context.fillStyle = rgba(0, 0, 255, 0.5)    // semi-transparent
context.fillStyle = rgba(0, 0, 255, 1)        // opaque
When you set the context.strokeStyle or context.fillStyle attributes, whatever value you set becomes the default value for all subsequently drawn shapes, until you set a new value.
Applying Gradients
A gradient is a smooth transition between colors. There are two types of gradients: linear and radial.
A linear gradient transitions the color along a line between two points. To create a linear gradient, call the createLinearGradient method:
createLinearGradient(x0, y0, x1, y1)
where (x0, y0) is the starting point and (x1, y1) is the ending point for the linear gradient.
A radial gradient transitions the color along a cone between two circles. To create a radial gradient, call the createRadialGradient method:
createRadialGradient(x0, y0, r0, x1, y1, r1)
where:
(x0, y0, r0)represents the starting circle, whose origin is(x0, y0)and whose radius isr0.(x1, y1, r1)represents the ending circle, whose origin is(x1, y1)and whose radius isr1.
Gradients must have two or more color stops, representing color shifts positioned from 0 to 1 between to the gradient's starting and end points or circles:
addColorStop(position,color)where:
positionspecifies the position of the color within the already defined starting and end points or circles, expressed as a number from0to1.colorspecifies the CSS color at that position.
For example, to define a gradient that varies from red to blue horizontally along a rectangular area:
- Create a gradient object:
var redbluegradient = context.createLinearGradient(0,0,100,0);
- Define the color stops:
        redbluegradient.addColorStop(0, "rgb(255,0,0)"); // red at the left side of the rectangle
        redbluegradient.addColorStop(1, "rgb(0,0,255)"); // blue at the right side of the rectangle
- Draw the shape and set a
fillStyleorstrokeStyle:context.fillStyle = redbluegradient; context.fillRect(0,0,100,150);
To define a gradient that varies from red to blue vertically along a rectangle:
- Create a gradient object:
var redbluegradient = context.createLinearGradient(0,0,0,150);
- Define the color stops:
    redbluegradient.addColorStop(0, "rgb(255,0,0)"); // red at the top of the rectangle
    redbluegradient.addColorStop(1, "rgb(0,0,255)"); // blue at the bottom of the rectangle
- Draw the shape and set a
fillStyleorstrokeStyle:context.fillStyle = redbluegradient; context.fillRect(0,0,100,150);
Note: A canvas gradient's color stops behave slightly differently than those used within non-canvas gradients. Webkit gradients specify mandatory from and to colors, with optional color-stop values for additional color shifts within the overall range of the gradient. For canvas gradients, even the initial and final colors are defined as color stops.
Applying Shadows
To add a shadow effect to a drawing on a canvas, set the following attributes:
shadowColorsets the color of the shadow. The value can be any CSS color value. The default value is transparent black ("rgba(0,0,0,0)").shadowBlursets the amount of blur in the shadow, in pixels. The value can be any positive number or 0. A value of 0 produces a sharp shadow with no blur.shadowOffsetXsets the number of pixels the shadow extends horizontally from the object drawn. If this value is a positive number, the shadow extends to the right of the object. If negative, the shadow extends to the left of the object. The default value is 0 pixels.shadowOffsetYsets the number of pixels the shadow extends vertically from the object drawn. If this value is a positive number, the shadow extends below the object. If negative, the shadow extends above the object. The default value is 0 pixels.
The following example code adds a semi-transparent black shadow to the bottom right of a blue rectangle:
    var context        = canvas.getContext("2d");
    context.shadowOffsetX    = 5;
    context.shadowOffsetY    = 5;
    context.shadowBlur    = 10;
    context.shadowColor    = "rgba(0,0,0,0.5)";
    context.fillStyle    = "#0000FF";
    context.fillRect    = (0,0,100,50)
Transforming Graphics
When drawing shapes and paths, you can translate the canvas's origin, rotate the canvas around the origin, scale the units in the canvas grid, and modify the transformation matrix directly.
Translating the Canvas Origin
Translating the origin enables you to draw patterns of different objects on the canvas without having to measure the coordinates manually for each shape. To translate the origin of the canvas, use the translate method:
context.translate(x,y);
where:
xis the horizontal distance that the origin is translated, in coordinate space unitsyis the vertical distance that the origin is translated, in coordinate space units
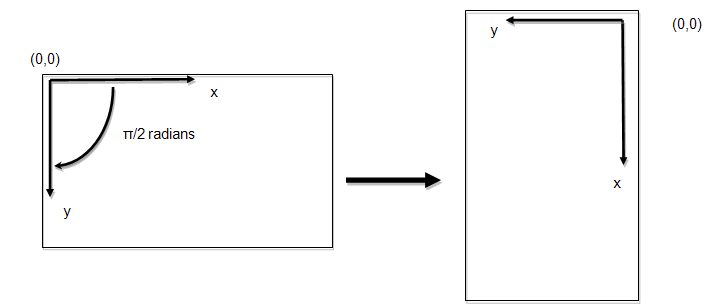
Rotating the Canvas
To rotate the canvas around the current origin, call the rotate() method:
context.rotate(angle);where angle is the clockwise rotation angle in radians. The number of radians is the number of degrees multiplied by Π/180, expressed in JavaScript as:
var radians = (Math.PI/180)*degrees;
Scaling the Canvas Grid
To increase or decrease the size of each unit in the canvas grid, call the scale method:
context.scale(x,y);
where:
xis the scale factor in the horizontal directionyis the scale factor in the vertical direction
The scale factors are in multiples. For example, scale(2.0, 0.5) would double the horizontal size of an object drawn on the canvas and half its vertical size, as shown below:

Manipulating the Transformation Matrix
Modifying the transformation matrix directly enables you to perform scaling, rotating, and translating transformations in a single step.
The transformation matrix is an affine transformation matrix from linear algebra. Affine transformations preserve colinearity and relative distance in the transformed coordinate space. This means that points in a line remain in a line, parallel lines remain parallel, and the distance between lines and objects maintains the same ratio, even if a scale factor is applied. Repositioning by translation, rotation, or skewing is also possible.
Each point on the canvas is multiplied by the matrix before anything is drawn. The HTML5 Canvas API defines the transformation matrix as:

where:
ais the scale factor in the horizontal (x) direction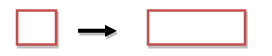
cis the skew factor in the x direction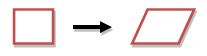
eis the translation in the x direction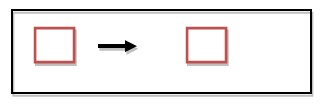
bis the skew factor in the y (vertical) direction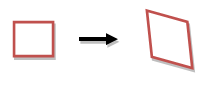
dis the scale factor in the y direction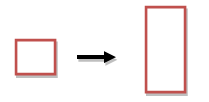
fis the translation in the y direction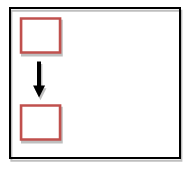
- the last row remains constant
The scale factors and skew factors are multiples; e and f are coordinate space units, just like the units in the translate(x,y) method.
The rotation transformation matrix is as follows:
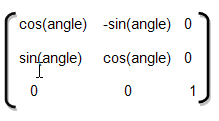
where the angle of rotation is in radians.
See Also: senocular.com for a good explanation of how transformation matrices are used identically within Adobe Flash.
Canvas Animations
You can animate a canvas drawing by repeatedly redrawing the canvas for each frame and translating, rotating, skewing, and scaling the drawn objects.
To draw each frame by employing the HTML5 canvas API, you should define the original canvas state and save it for future reference. The drawing context maintains a stack of drawing states. Each state consists of the current transformation matrix, current clipping region, and current values of the following attributes:
strokeStylefillStyleglobalAlphalineWidthlineCaplineJoinmiterLimitshadowOffsetXshadowOffsetYshadowBlurshadowColorglobalCompositeOperationfonttextAligntextBaseline
The current path and the current bitmap are NOT part of the drawing state. The path can be reset only by invoking the beginPath() method. The current bitmap is a property of the canvas, not of the context.
To save the original canvas state, call the save() method:
context.save();Before drawing each new frame, you must clear the canvas:
canvas.clearRect(x,y,width,height);
where:
xis the position of the top left corner of the canvas on the horizontal axisyis the position of the top left corner of the canvas on the vertical axiswidthis the width of the canvasheightis the height of the canvas
Draw the new frame using any of the methods provided by the canvas API. Then save it by calling the save() method.
If you wish to return to the state of the original frame as the basis for each new frame that you draw, call the context.restore() method.
To execute the drawing methods repeatedly, use the standard JavaScript-based animation technique, calling the setInterval() and clearInterval() methods. The following shows how to execute an animation function every 50 milliseconds (corresponding to 20 times per second, a typical animation frame rate), then subsequently halt the animation:
var id = setInterval(functionName, 50);
clearInterval(id);
See Also:
- CanvasDemos.com: animated cartoon, which discusses how to use Canvas as an animation framework.
- HTML5 Canvas Cheat Sheet
- QtWebKit Guide -back to the main page
© 2016 The Qt Company Ltd. Documentation contributions included herein are the copyrights of their respective owners. The documentation provided herein is licensed under the terms of the GNU Free Documentation License version 1.3 as published by the Free Software Foundation. Qt and respective logos are trademarks of The Qt Company Ltd. in Finland and/or other countries worldwide. All other trademarks are property of their respective owners.